

Technical Analysis Guide
Learn the fundamentals of technical analysis to identify market trends and key levels.
Welcome to our Technical Analysis (TA) Guide.
In this guide, we cover the fundamentals of technical analysis—commonly referred to as TA.
TA can help you identify market trends and key support and resistance levels. With that insight, you can make more informed decisions, such as:
- Whether to turn your bot on or off
- Which strategies to configure
After reading this guide, you’ll be able to determine the trend using our Market Tools.
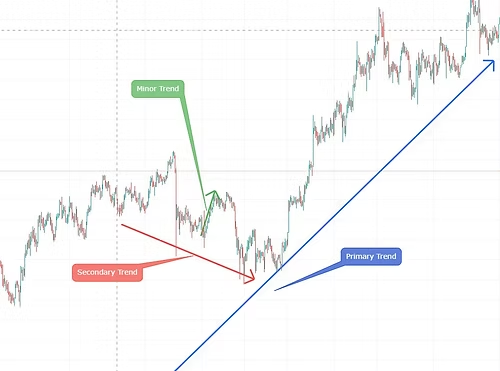
Before entering a trade, it’s important to understand the market’s overall direction. Dow Theory, introduced by Charles Dow, suggests that market movement can be viewed through three types of trends:
- Primary trend
- Secondary trend
- Minor trend
The primary trend represents the dominant direction over a longer time horizon. Within that broader move, the market often experiences secondary trends—shorter-term movements that can temporarily move against the primary direction (pullbacks during an uptrend or rallies during a downtrend). Even within these movements, minor trends occur as smaller fluctuations.
Markets do not move in straight lines. Whether the market is rising or falling overall, price action typically moves in a zig-zag pattern. For that reason, understanding the primary trend is essential—it has the greatest influence on long-term outcomes.
Identifying a market trend is straightforward. The key question is whether the market is advancing (bullish) or declining (bearish).
- In an uptrend, price forms higher highs and higher lows.
- In a downtrend, price forms lower highs and lower lows.
The price of a coin or token often moves between key price zones. Some levels become significant because market participants repeatedly react to them.
These zones act as:
- Support: an area where buying interest tends to prevent price from falling further
- Resistance: an area where selling pressure tends to prevent price from rising further
For example, a price range may initially act as support if buyers consistently step in at that level. If price later breaks below that support, the same range can begin to act as resistance—meaning price may struggle to rise above it as sellers become more active there.
To apply TA in practice, start by identifying which trend you intend to trade. For example, the primary trend may be downward while the secondary trend is upward. Trading against the primary trend typically involves higher risk, so whether to trade the secondary move depends on your risk tolerance and approach.
If you choose to trade the secondary trend, the next step is to assess nearby support and resistance zones. For instance, if BTC is trading around the 50K–52K range and 52K is acting as resistance, it suggests many traders are selling at that level. If price breaks above resistance, it may indicate that market participants are willing to value BTC higher, in which case the next resistance zone (e.g., 54K–56K) becomes the next area to monitor.
At this stage, three outcomes are common:
- Breakout to the upside
- Breakout to the downside
- Continued sideways movement
In many cases, the most prudent approach is to wait for confirmation before acting. Trading in the direction of an established trend is generally safer and often provides better opportunities.
If price breaks upward, traders may consider configuring bullish-oriented approaches, particularly those suited for higher volatility and larger moves.
If price breaks downward (or is rejected at resistance), traders may consider bearish-oriented approaches—keeping in mind that trading against the larger trend or pre-positioning before confirmation can involve additional risk.
If price remains sideways, traders may consider approaches designed for range-bound conditions, where smaller moves are captured more frequently.
Always conduct your own research before trading.